



Disclaimer: This article is for informational purposes only and does not constitute financial advice. All market data is as of 6 August 2026 and refers primarily to US markets; availability, taxation and costs differ by country of residence. Past performance does not predict future returns. Consult a qualified adviser before making investment decisions.
Investors entering the second half of 2026 face a very different backdrop from the one most 2025 outlooks predicted. Instead of a smooth easing cycle, inflation re-accelerated through the spring, the Federal Reserve stopped cutting, and conflict in the Middle East pushed energy prices – and bond yields – higher. Cash and short-dated bonds still pay well, US equities are at record highs on the back of AI-driven earnings, and gold has given back a large part of a spectacular rally.
This guide covers seven asset classes that institutional research teams are focused on right now: what each one actually pays today, what has to happen for it to work, what can go wrong, and which type of investor it fits. Every figure is dated and sourced.
The 2026 Backdrop in Four Numbers
- Fed funds target: 3.50%-3.75%. The FOMC has held rates steady, and the June 2026 projections showed nine of eighteen participants penciling in at least one hike this year. Futures markets have been pricing roughly one increase by year-end.
- US inflation: 3.5% headline, 2.6% core (June 2026, released 14 July). Headline peaked at 4.2% in May – the highest since April 2023 – before falling back as energy prices dropped.
- 10-year Treasury: around 4.6%, after touching an 18-month high near 4.75% in early August. The 30-year sits above 5%.
- S&P 500: record territory, with an all-time high of 7,789 set on 5 August 2026.
Two consequences follow. First, the “rate cuts will lift everything” trade that dominated 2025 forecasts has not materialised – several assets have done well despite higher yields, not because of lower ones. Second, with cash paying around 4% and inflation at 3.5%, the real return on safety is thin but positive, which raises the bar for every riskier asset on this list.
Summary Table: 7 Investments to Understand in 2026
| Investment | Risk Level | What it pays today | Investor Profile |
|---|---|---|---|
| High-Yield Savings & Money Market | Very Low | ~4.0–4.2% APY on top accounts | Conservative, 0–3 year horizon |
| Government Bonds | Low (credit) / Medium (duration) | ~4.0% at 1 year, ~4.6% at 10 years, ~5.2% at 30 years | Income-focused, longer horizon |
| Corporate Bonds | Medium | ~5.2% investment grade; ~7.5–8% high yield | Income-seeking, moderate risk |
| U.S. Stocks (Large-Cap) | High | ~21x forward earnings; earnings doing the work | Growth-oriented, 5+ years |
| International/EM Stocks | High | ~11.7x forward earnings; high expected EPS growth | Diversification, 5–10 years |
| Real Estate (REITs) | Medium | Dividend yield near 4% | Income & diversification, 3+ years |
| Gold & Precious Metals | Medium-High | No income; price-driven only | Hedge, small allocation |
1. Cash and Cash Equivalents (High-Yield Savings & Money Market)
Cash is still paying. Leading online savings accounts and money market accounts offered roughly 4.0% to 4.2% APY in August 2026, and short Treasury bills yielded about 4% at one year. That is a genuine, contractual return with no principal risk – something that did not exist for most of the 2010s.
Why it matters now: because the Fed has stopped cutting. The whole premise of 2025’s outlooks was that deposit rates would fall quickly through 2026. They have not. With the policy rate held at 3.50%–3.75% and the committee openly debating a hike, the reinvestment risk that usually punishes cash savers has been postponed.
The catch that most articles skip: the headline rate is not what most savers get. The FDIC put the average APY across all US savings accounts at 0.38% as of 20 July 2026, because the largest national banks pay close to nothing. The 4% is available, but only to people who actively move their money to an online bank or a money market fund. Leaving cash in a legacy account is a silent 3.5-point annual cost.
The real return: at 4.1% nominal against 3.5% headline inflation, you are preserving purchasing power with a small margin – not building wealth. Cash protects; it does not compound meaningfully. And promotional rates can reset without notice.
- Risk: Very Low – deposit insurance applies within statutory limits; money market funds carry minimal but non-zero risk.
- What you earn: ~4.0–4.2% APY on competitive accounts, variable and subject to change at any time.
- Best for: Emergency funds, money needed within 0–3 years, and dry powder waiting for opportunities.
2. Government Bonds (Treasuries and Sovereign Debt)
Government bonds are where the 2025 consensus was most wrong, and the lesson is worth stating plainly: the case for bonds was built on rate cuts that never arrived. Yields went up, not down. Investors who bought long duration expecting quick capital gains have instead been relying on the coupon.

Where the curve sits (4 August 2026): 1-year 4.00%, 2-year 4.21%, 5-year 4.34%, 10-year 4.63%, 30-year 5.20%. The curve has a normal upward slope again, so investors are finally being paid something to extend maturity – but not much between one and five years.
Why yields are elevated: inflation ran hotter than expected through the first half of the year, driven substantially by energy after the disruption to Gulf shipping. Headline CPI hit 4.2% in May before falling to 3.5% in June as a partial reopening of the Strait of Hormuz pulled fuel prices down. Fed Chair Kevin Warsh publicly cautioned against reading the June print as “mission accomplished”. Long-dated yields also reflect fiscal supply, not just policy expectations.
The trade-off, stated honestly: a 10-year Treasury bought at 4.6% locks in a nominal return you will actually receive if you hold to maturity. But every 1% rise in market yields costs a long-dated bond a substantial chunk of its price, and 2026 has already shown that yields can rise on an inflation shock even when the economy is not booming. Duration is a decision, not a detail. Short and intermediate maturities give you most of the yield with a fraction of the price sensitivity.
- Risk: Low credit risk for major sovereigns; meaningful interest-rate risk at long maturities.
- What you earn: the yield at purchase, if held to maturity. Total return in any given year can be negative if yields rise.
- Best for: Income-focused investors who match maturity to when they need the money. Consider shorter maturities if you may need to sell early.
3. Corporate Bonds (Investment-Grade and High-Yield)
Corporate bonds present a split picture in 2026: attractive all-in yields, unattractive risk premiums. Understanding the difference is the whole analysis.
Investment grade: the ICE BofA US Corporate Index yielded roughly 5.2% in mid-2026, near the upper end of its range since the financial crisis. But the option-adjusted spread over Treasuries closed the second quarter around 74–80 basis points – inside the first percentile of the last twenty years, against a ten-year average closer to 130bp. Almost all of that 5.2% is the Treasury yield; very little is compensation for credit risk.
High yield: around 7.5–8%, with spreads in the region of 285–350bp against a twenty-year average near 490bp. Charles Schwab’s fixed income team has kept an explicit “up in quality” stance for exactly this reason: you are being paid a good absolute yield, but you are not being paid much extra for taking default risk.
What that means practically. With spreads this tight there is little room for prices to rise relative to Treasuries – the upside from spread compression is largely spent. The asymmetry runs the other way: if the economic outlook deteriorates, spreads widen from a very low base and prices fall. The sensible framing is that corporate bonds are an income holding today, not a capital-gains play. One structural positive: the credit quality of the high-yield index has improved over the past decade, with BB-rated issuers now making up more than half of it.
- Risk: Low-Medium for investment grade; Medium-High for high yield, which behaves partly like equity in a downturn.
- What you earn: ~5.2% investment grade, ~7.5–8% high yield, minus any defaults and fund costs.
- Best for: Income investors with a 3–5 year horizon. Most retail investors should access this through diversified funds or ETFs rather than single issuers.
4. U.S. Stocks (Large-Cap Equities)
US large caps have kept climbing through an inflation scare, a geopolitical shock and a Fed that stopped easing. The S&P 500 set an all-time high of 7,789 on 5 August 2026. What has driven it is not multiple expansion – it is profits.
The earnings engine. Goldman Sachs Research raised its year-end 2026 S&P 500 target to 8,000 in late May, based on earnings per share of $340 for 2026 – roughly 24% annual growth – and $385 for 2027. Their strategists expect the valuation multiple to stay flat at about 21 times earnings, meaning the projected return comes from profits rather than from investors paying more for each dollar of them.
The concentration problem. Goldman also estimates that AI-infrastructure beneficiaries account for roughly half of this year’s earnings growth. That is the single most important sentence for anyone buying an S&P 500 tracker today. You are not buying a diversified slice of the American economy in equal measure; you are buying an index whose profit growth currently depends heavily on one capital-expenditure cycle. If that spending slows, the earnings math that justifies 21x changes quickly.
What could go wrong: a further leg up in inflation forcing the Fed to hike; any sign that AI capital spending is decelerating; and simple seasonality – Bank of America’s work shows August to October has historically been the weakest three-month stretch of the year since 1928, with typical pullbacks around 7%. A 7% drawdown is normal market behaviour, not a crisis, but it is worth knowing before you deploy a lump sum in August.
- Risk: High – elevated valuation and heavy concentration in AI-linked earnings amplify both directions.
- What drives returns from here: earnings delivery, not re-rating, on current sell-side assumptions.
- Best for: Long-term investors with a 5+ year horizon who can tolerate double-digit drawdowns. Phased investing reduces timing risk at record highs.
5. International & Emerging Market Stocks
The emerging markets story has changed materially since our previous edition – and mostly in a good way. The MSCI Emerging Markets Index returned 33.6% in 2025, beating both the S&P 500 (17.9%) and the MSCI World, its best year against developed markets since 2017. The rally continued into 2026.
Valuations after a big rally. EM is no longer the deep-value trade it was two years ago, but it is still not expensive: RBC Wealth Management put the MSCI EM Index at 11.7x forward earnings in late May 2026, below its ten-year average of 12.2x and in line with its twenty-year average – while the US trades around 21x. The discount to the US remains wide by historical standards.
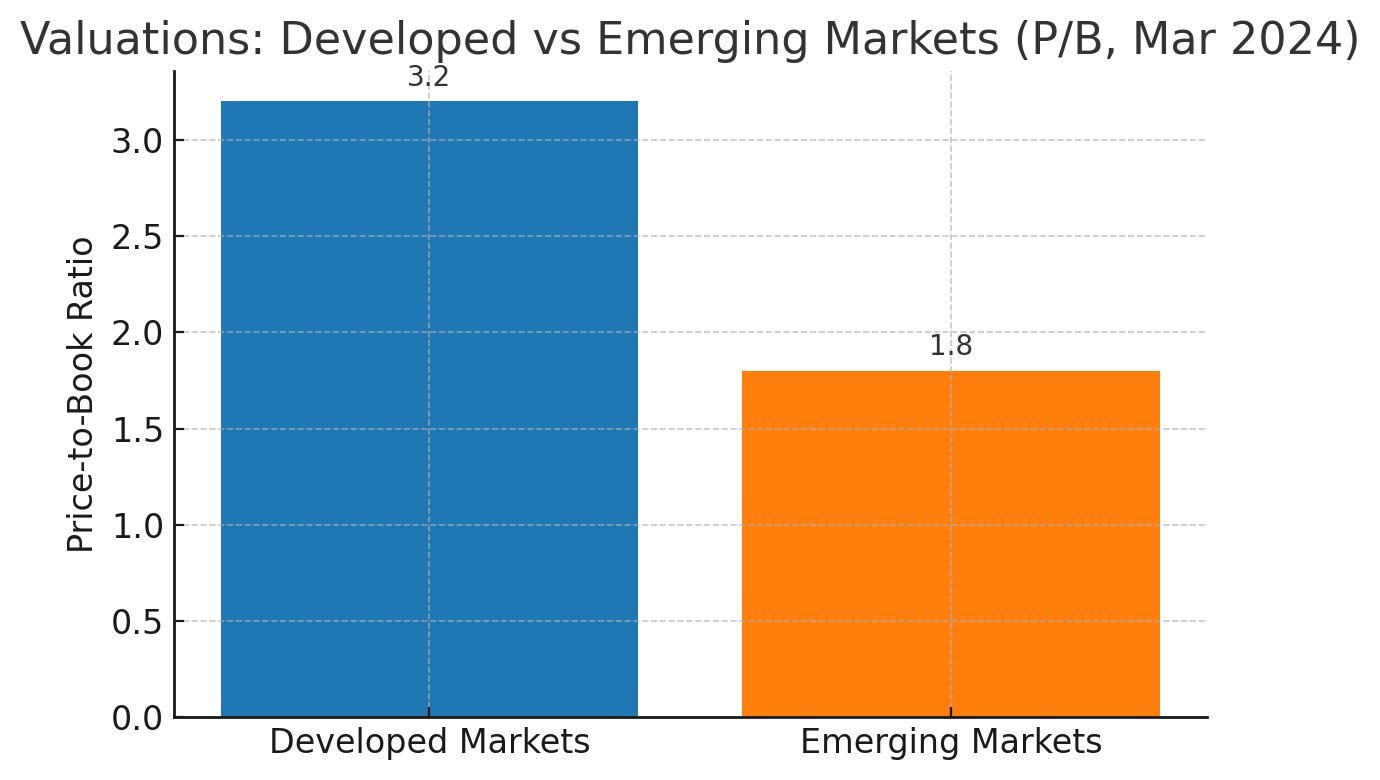
Historical comparison of developed and emerging market valuation multiples. The structural discount shown here has narrowed since the 2025 rally; current forward multiples are cited in the text above.
Earnings, not just cheapness. This is the important shift. For fifteen years the EM problem was that faster economic growth did not translate into faster profit growth. Consensus estimates for 2026 finally point the other way, with EM earnings growth expected to exceed developed-market growth by a wide margin. Semiconductor and AI-related demand across North Asia is doing much of the heavy lifting.
The risk nobody advertises: concentration. Lazard notes that the top ten companies now make up about one-third of the MSCI EM Index, with TSMC alone above 12%. An “emerging markets” fund today is, to a significant degree, a bet on Asian semiconductor supply chains – which means it may be far more correlated with US technology stocks than the label suggests. If you hold both an S&P 500 tracker and an EM tracker for diversification, check how much of each is exposed to the same theme.
Other risks are the familiar ones: currency moves (a weaker dollar flattered 2025 returns and could reverse), trade policy, and the fact that EM drawdowns tend to be deeper and longer than developed-market ones.
- Risk: High – currency, political and index-concentration risk on top of normal equity volatility.
- What drives returns from here: delivery on high consensus earnings expectations, plus the dollar.
- Best for: Diversification within an equity allocation, 5–10 year horizon, sized so a 30% drawdown would not force you to sell.
6. Real Estate (REITs)
REITs have quietly been one of 2026’s better stories, and they have done it while breaking the rule that everyone repeats about them.
The performance. Janus Henderson reported US REITs up 18% year-to-date through 12 June 2026, with every property type positive – roughly double the S&P 500’s return over the same period. That followed a poor 2025, in which US listed REITs returned only about 2.3% while the S&P 500 gained around 17%. Nareit’s mid-year review reached the same conclusion: REITs outperformed the broad equity market by a sizeable margin.
Why it matters that this happened with yields rising. The standard argument for REITs in 2025 outlooks was that they were a leveraged bet on rate cuts. In 2026 the 10-year Treasury yield rose from about 3.9% in February to as high as 4.7% in May – and REITs outperformed anyway. What drove it was earnings growth, constrained new construction supply, balance-sheet strength and a starting valuation that was historically cheap. That is a more durable set of reasons than “rates will fall”.
Where the growth is: data centres and senior housing have led, driven by AI-related computing demand and demographics respectively; logistics and residential remain favoured by most institutional allocators. Office remains the problem child and is where sector selection matters most.
What to watch: after an 18% run, the valuation discount that powered the move has partly closed. REITs also remain equities – they can and do fall 20%+ in a bad year – and they carry debt, so a sustained move higher in long yields eventually raises refinancing costs.
- Risk: Medium – equity-like volatility, sector dispersion, sensitivity to financing costs.
- What you earn: a dividend yield near 4%, plus or minus price movement.
- Best for: Investors wanting income plus a diversifier alongside stocks and bonds, 3+ year horizon.
7. Gold and Precious Metals
Gold deserves the most careful treatment on this list, because the last twelve months delivered both the strongest possible argument for owning it and the clearest possible warning about how it behaves.
The rally and the reversal. Gold surged through 2025 and into January 2026, reaching an all-time high of roughly $5,597 per ounce on 29 January 2026. Since then it has fallen back, trading in the $4,100–$4,300 range in early August 2026 – roughly a quarter below the peak. Silver was more extreme still: from about $40 an ounce in September 2025 to a peak near $116 in late January, then back to around $59 by late July.
Read that sequence carefully. An investor who bought gold in mid-2025 has done extremely well. An investor who bought in the last days of January – precisely when the coverage was most enthusiastic – is sitting on a substantial loss. Gold is a hedge, and hedges are bought when they are boring, not when they are on the front page. It pays no income, so there is nothing to cushion a drawdown while you wait.
What still supports it: central bank buying has continued as reserve managers diversify away from the dollar; geopolitical risk in the Gulf remains unresolved; and gold has performed as intended during equity-market wobbles. What works against it: with cash paying around 4% and the Fed potentially hiking rather than cutting, the opportunity cost of holding a zero-income asset is real.
On forecasts, a note of caution. J.P. Morgan Global Research has published a forecast for gold to average around $6,000 per ounce in the final quarter of 2026, rising toward $6,300 by end-2027. That target sits far above the current spot price, and bank forecasts across the market were revised sharply during June and July after the January peak unwound. Treat any single price target as one scenario with a publication date attached, not as a plan.
- Risk: Medium-High – no income, sentiment-driven, capable of 25%+ drawdowns as 2026 demonstrated.
- What you earn: nothing until you sell. All return is price.
- Best for: A small, deliberate allocation – commonly 2–10% – held as insurance rather than as a growth engine.
Comparing Risk and Return
The table below deliberately shows what each asset pays or costs today rather than a predicted return for the year. Starting yields and valuations are observable facts; twelve-month returns are not.
| Investment | Risk Level | Starting point (Aug 2026) | Main risk in 2026 |
|---|---|---|---|
| Cash & Equivalents | Very Low | ~4.0–4.2% APY on top accounts | Rates reset lower; inflation erodes the small real return |
| Government Bonds | Low credit / Medium duration | 4.00% (1y) to 5.20% (30y) | Another inflation surprise pushing yields higher |
| Corporate Bonds | Medium | ~5.2% IG; ~7.5–8% HY | Spreads near 20-year lows leave no cushion if credit weakens |
| U.S. Stocks (Large-Cap) | High | ~21x forward earnings, record index level | AI capex slowdown undermining the earnings forecast |
| International/EM Stocks | High | ~11.7x forward earnings after a 33.6% year in 2025 | Index concentration in Asian semiconductors; dollar strength |
| Real Estate (REITs) | Medium | ~4% dividend yield, after +18% YTD to mid-June | Long yields staying high; valuation gap already narrowed |
| Gold & Precious Metals | Medium-High | ~$4,100–4,300/oz, ~25% below the January peak | Opportunity cost versus 4% cash; sentiment reversal |
Data as of 6 August 2026. Yields and valuations change daily; verify current levels before acting.
What Changed Since Our 2025 Edition
We think it is more useful to show where the previous consensus was wrong than to quietly rewrite it:
- The easing cycle stalled. Rate cuts were the central assumption behind the 2025 case for bonds, REITs and gold. Instead the Fed has held at 3.50%–3.75% and part of the committee has argued for hikes.
- Inflation went back up before coming down. Headline CPI reached 4.2% in May 2026, the highest since April 2023, largely on energy, before easing to 3.5% in June.
- REITs worked for a different reason than predicted. They outperformed while yields rose, driven by earnings and supply constraints rather than by falling rates.
- Emerging markets delivered – then stopped being cheap. A 33.6% total return in 2025 closed much of the valuation gap, and the index became far more concentrated.
- Gold did both things. It hit records, then fell roughly 25% from the January high, which is the more useful lesson.
Conclusion
The seven assets covered here are not a ranking and not a portfolio. They are the building blocks most institutional allocators are working with in the second half of 2026, each with a specific job: cash for liquidity, government bonds for a locked-in nominal return, corporate bonds for income, US and international equities for growth, REITs for income plus diversification, and gold as insurance.
Three things are worth holding on to. First, starting yields and valuations are the most reliable information you have – far more so than any twelve-month forecast, as this year’s revisions across gold and rates have shown. Second, diversification is doing less work than it appears if your US equity fund, your EM fund and several of your REITs are all exposed to the same AI infrastructure cycle. Check the overlap. Third, match each holding to the date you will need the money; almost every serious loss retail investors take comes from being forced to sell a volatile asset at the wrong moment.
Markets in 2026 have already surprised the consensus twice. Build a mix you can hold through the third surprise.
Sources and Data
- Federal Reserve – FOMC statement and minutes, June 2026 meeting (policy rate, projections).
- US Bureau of Labor Statistics – Consumer Price Index for June 2026, released 14 July 2026.
- US Treasury yield curve data, 4 August 2026; FDIC national savings rate data, 20 July 2026.
- Goldman Sachs Research – S&P 500 forecast update, 26 May 2026 (index target, EPS, multiple, AI contribution).
- Breckinridge Capital Advisors Q3 2026 corporate bond outlook and Charles Schwab 2026 fixed income mid-year outlook (IG yields, spreads, up-in-quality view).
- Lazard Asset Management and RBC Wealth Management – emerging markets 2026 research (2025 returns, forward multiples, index concentration).
- Janus Henderson REIT halftime report (12 June 2026) and Nareit 2026 mid-year update.
- J.P. Morgan Global Research gold price outlook (published June 2026); spot gold and silver price reporting, July–August 2026.
TradingChooser publishes broker research and may earn a commission from some of the links on this site. We do not sell, distribute or receive compensation for any of the asset classes discussed in this article, and nothing here is a recommendation to buy or sell a specific security. Capital is at risk.
